Machine learning · Team of 3 · 2026
Ho Chi Minh City Housing Market
Forecasting and segmenting district-level housing prices in Ho Chi Minh City, and showing how much of the growth disappears once you adjust for inflation.
Overview
A term project for DATA 300 (Statistical & Machine Learning), built with a team of three. We analyzed residential housing prices across nine Ho Chi Minh City districts from 2017 to 2022, merging price data with CPI, population, and spatial data to understand how the market really grew and whether short-term prices could be forecast.
Problem
Headline housing prices in a fast-growing, inflationary economy can be misleading. We wanted to know how much of the apparent growth was real, which districts behaved differently from the rest, and how far ahead prices could be meaningfully predicted.
What I Built
- A data pipeline merging district-level prices with CPI, population, and spatial features
- Inflation-adjusted (real) price series alongside nominal prices for every district
- 1-, 7-, and 30-day XGBoost forecasts, each benchmarked against a naive baseline
- k-means clustering with PCA to group districts by their price patterns
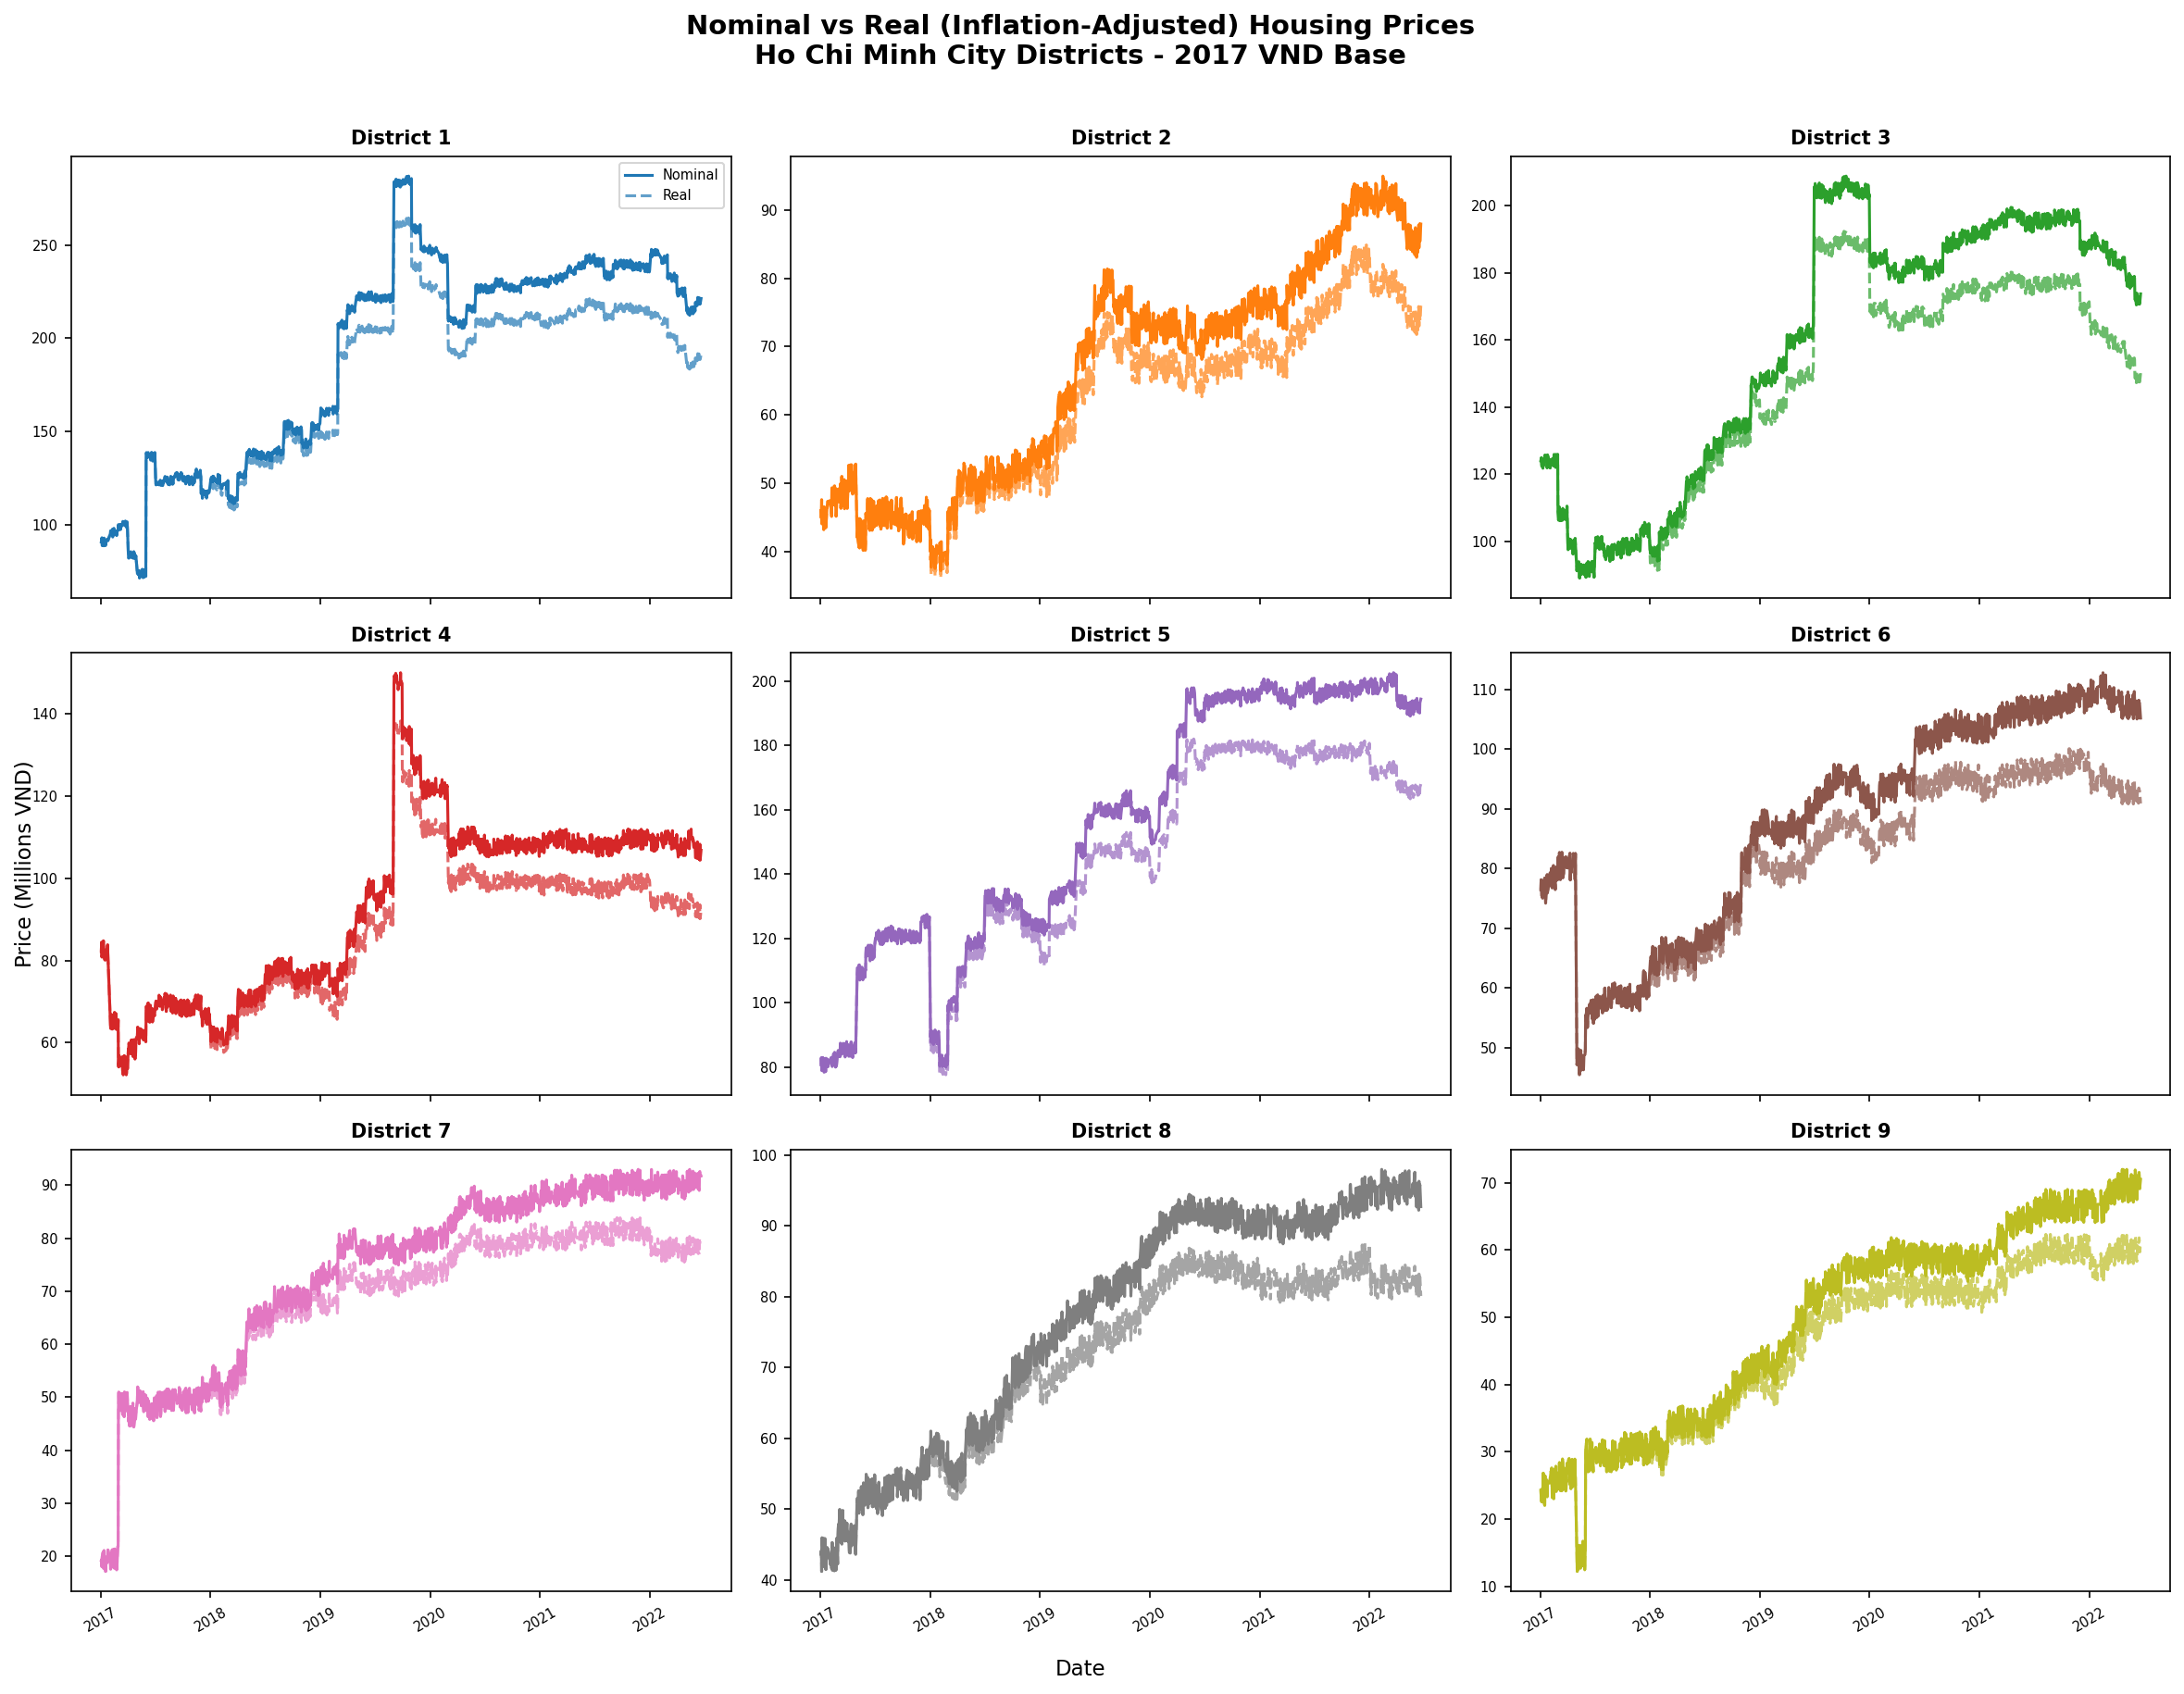 Nominal (solid) vs. inflation-adjusted (dashed) prices across nine districts, 2017–2022
Findings
- Inflation changed the story. Some districts showed only ~19–21% real growth against ~38–40% nominal growth.
- District 7 is an outlier. Clustering separated it as a low-price, high-growth district (~313% real growth), a pattern linked to its distance from the city center and its density.
- Forecasting has limits. The lag feature drove most of the model’s accuracy, and 30-day growth forecasts barely beat a zero-growth baseline. We reported this as a limitation rather than overselling the model.
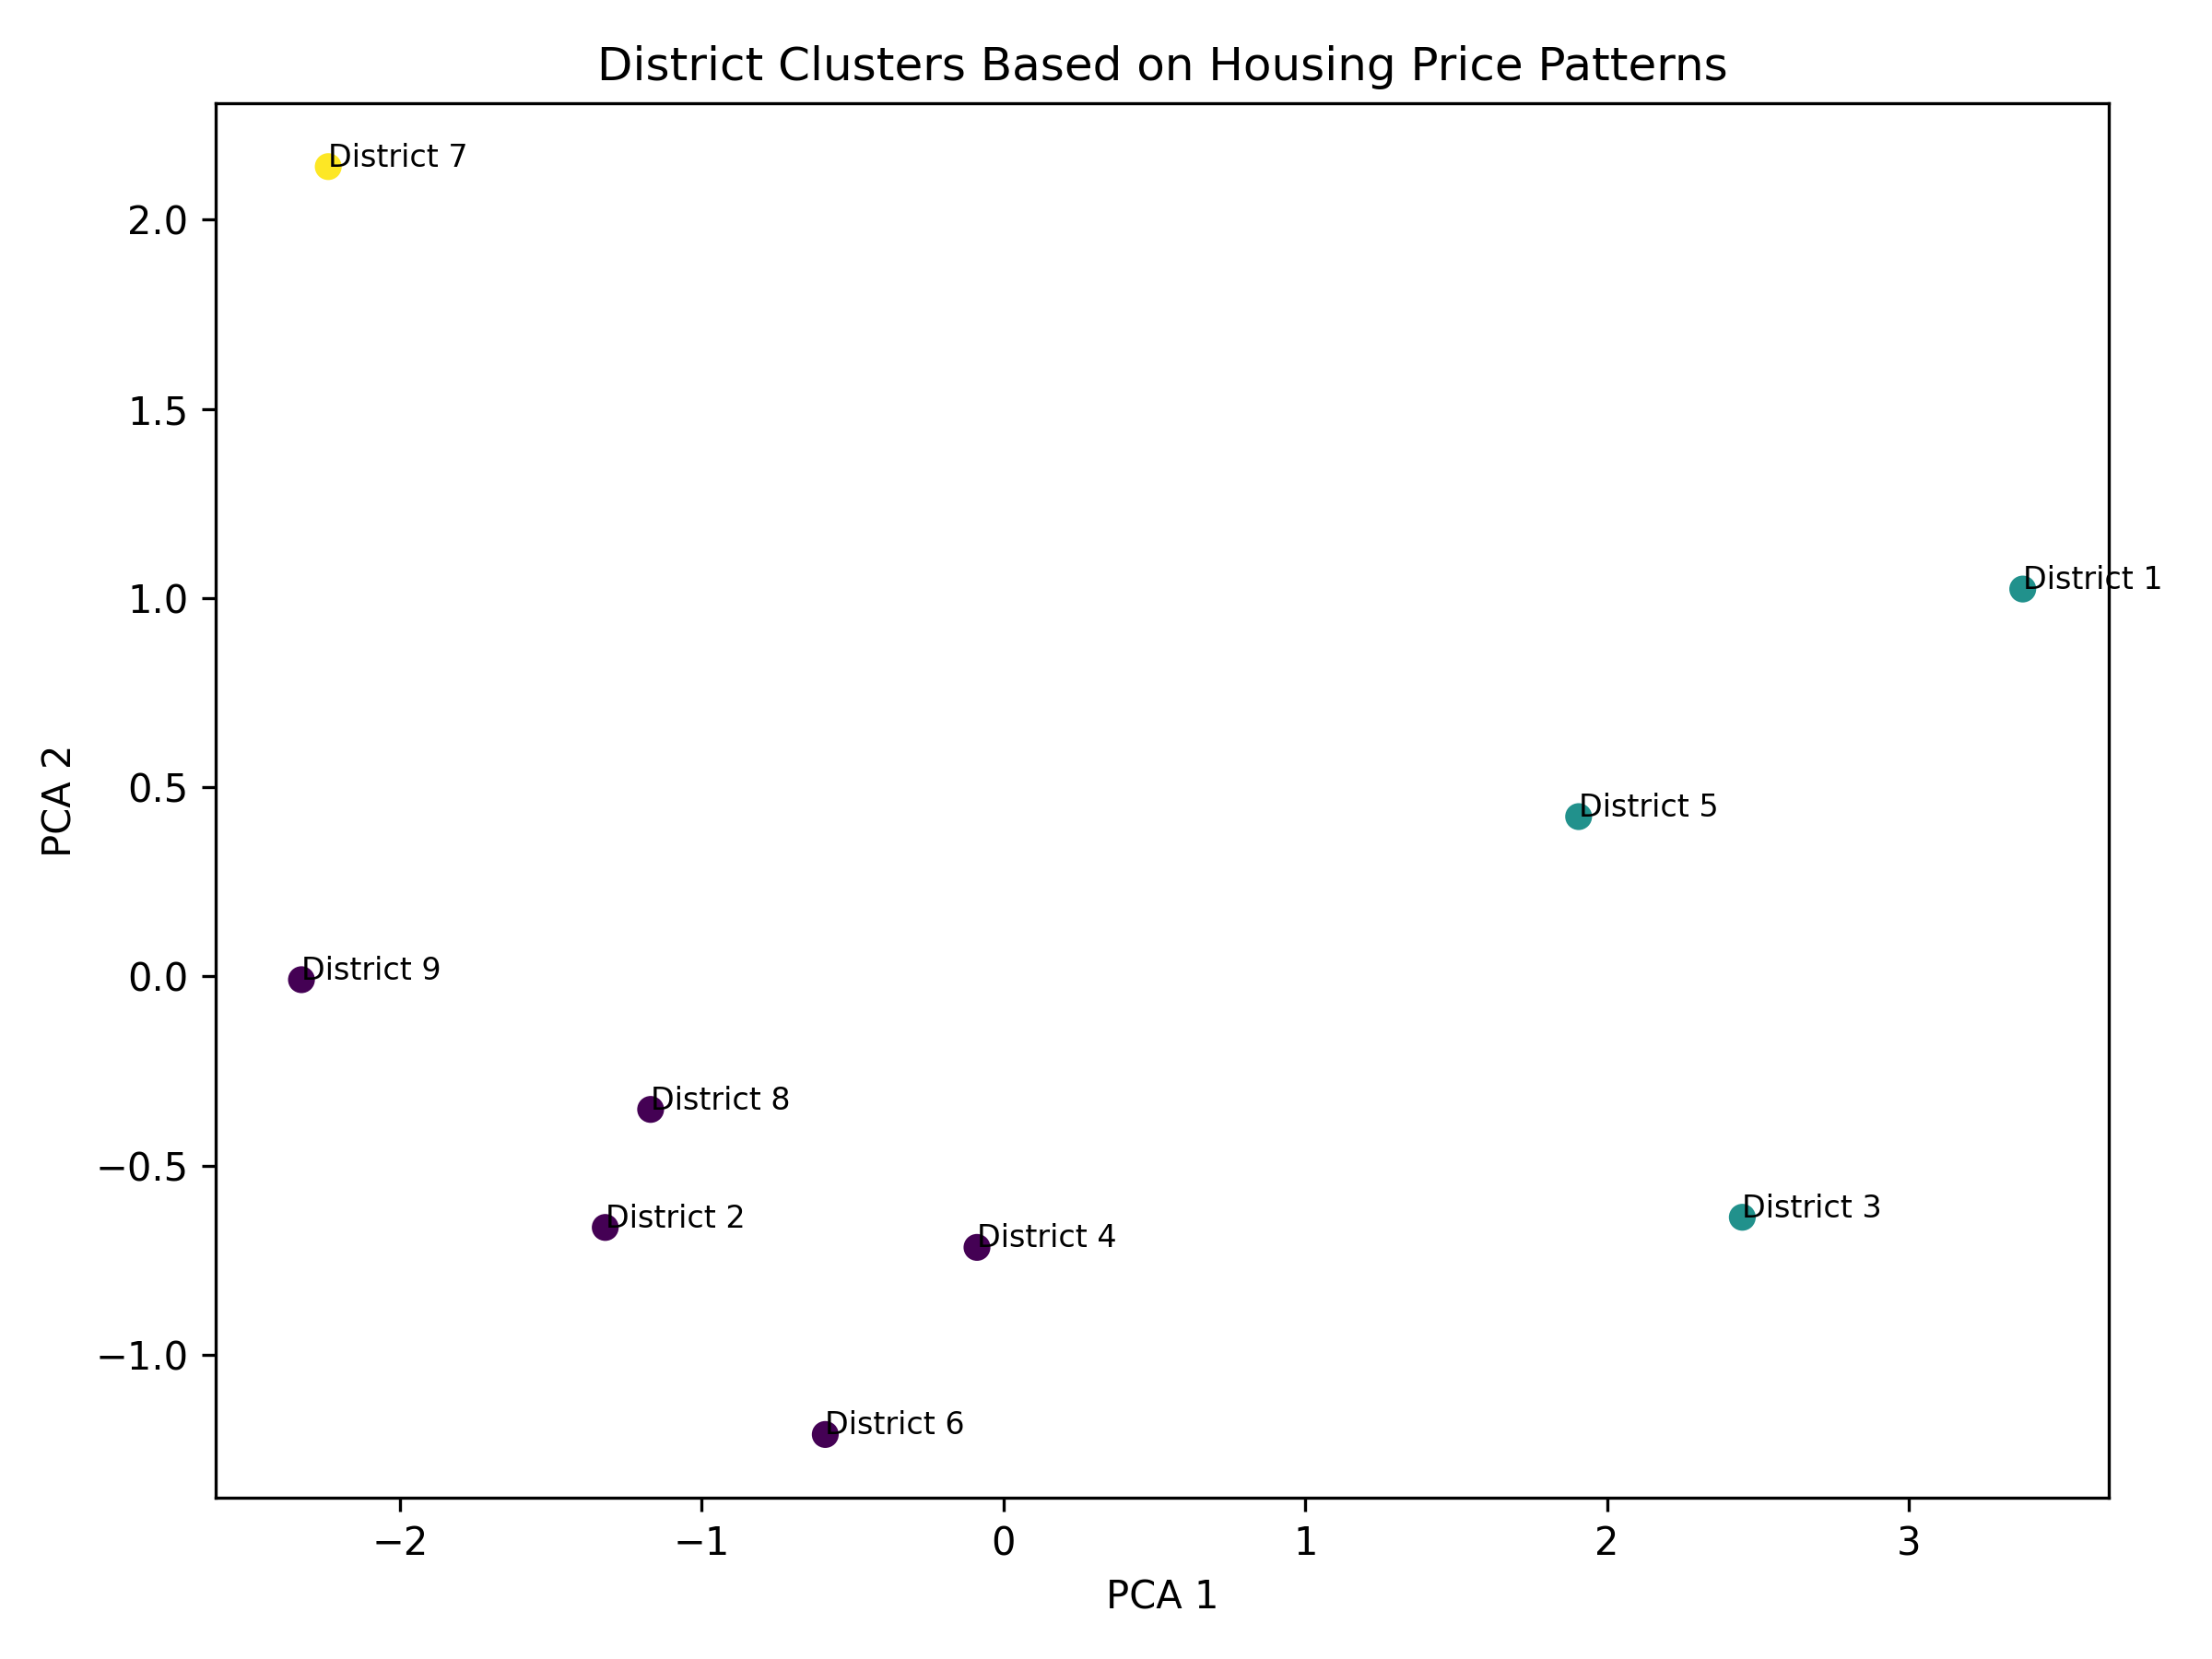 Districts clustered on housing price patterns; District 7 sits apart from every other district
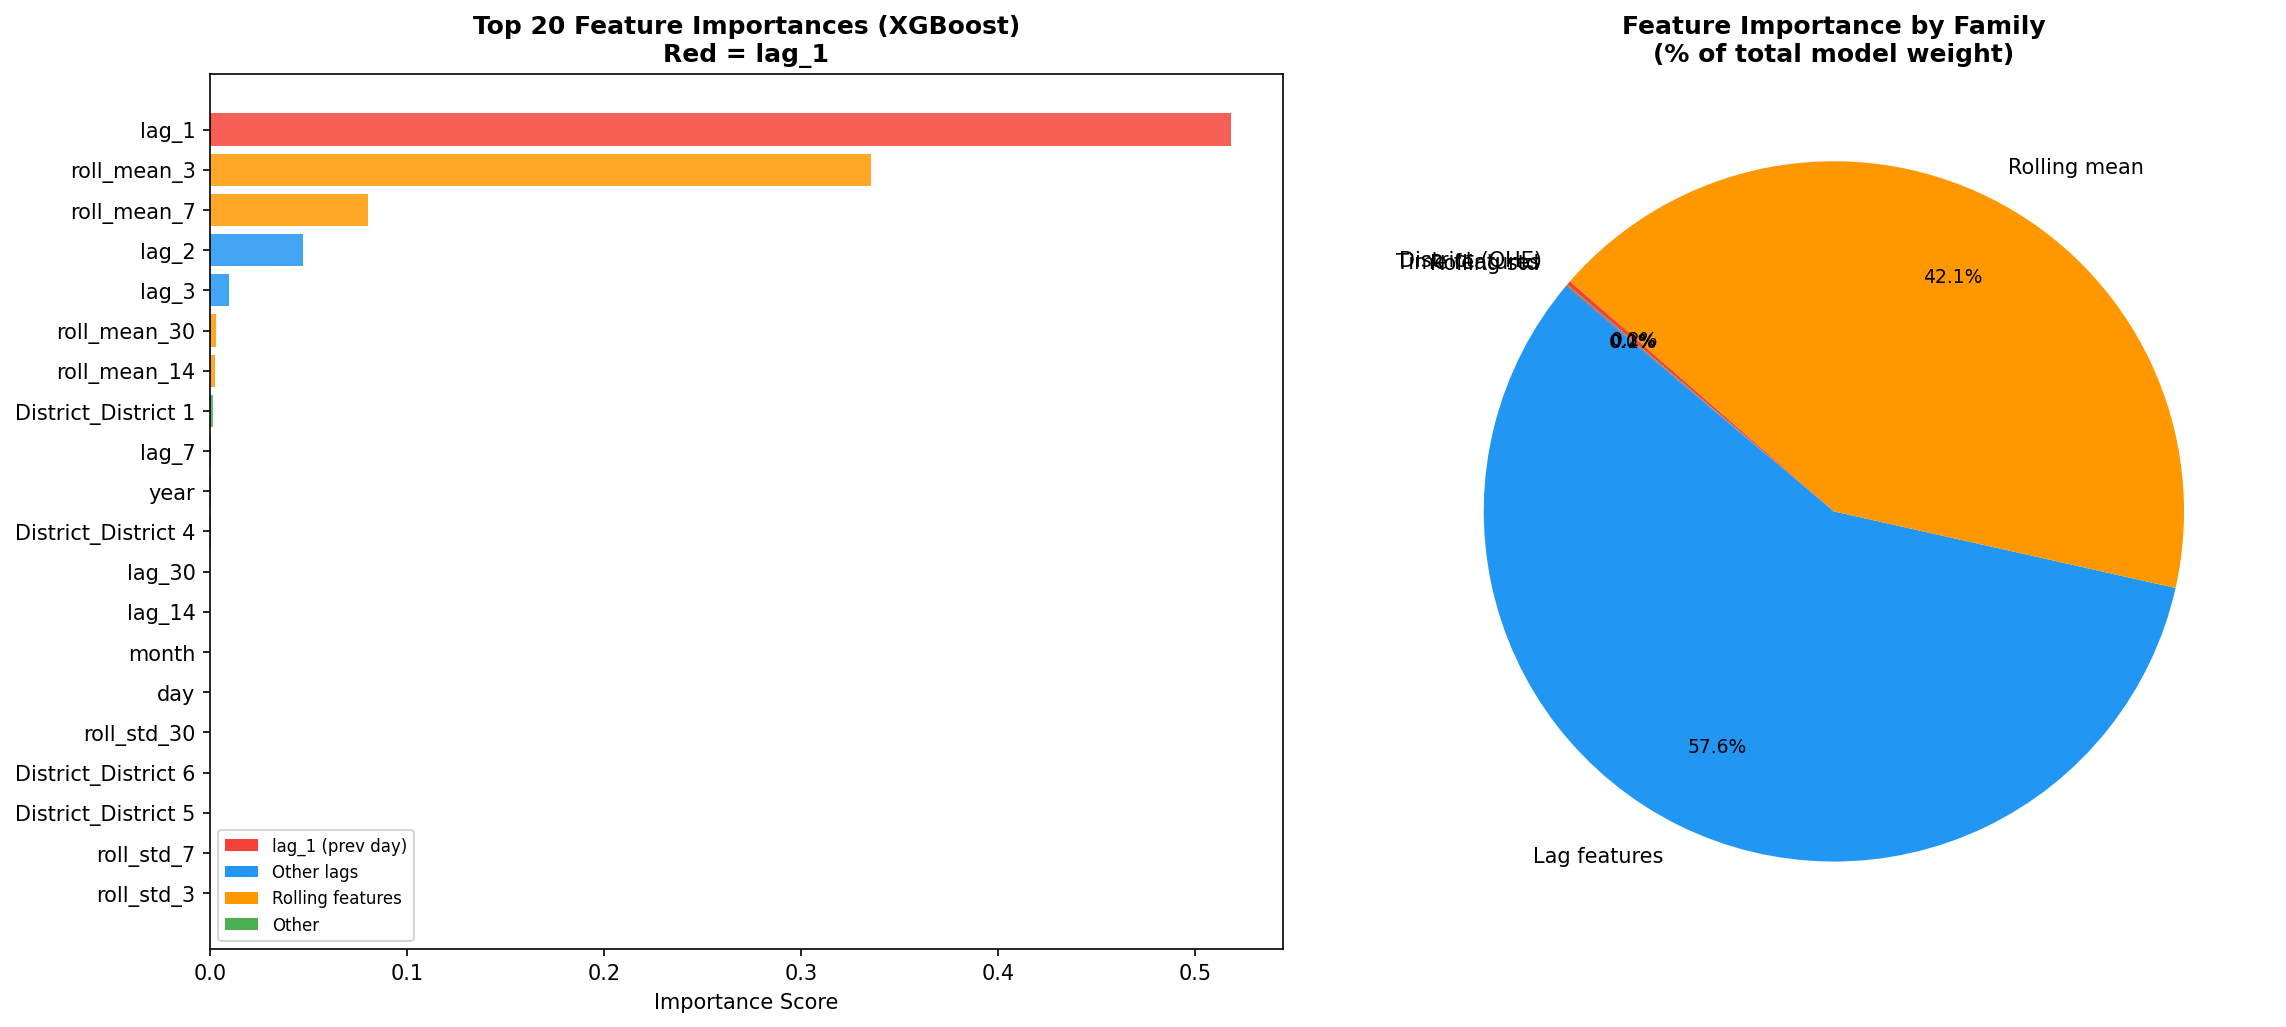 The previous day’s price (lag_1) carries most of the XGBoost model’s weight
Outcome
The project was a practical lesson in why baselines and inflation adjustment matter: a model can look accurate while adding little over “tomorrow looks like today,” and nominal numbers can make growth look roughly twice as large as it really was.